Assignment: Running a Chi-Square Test of Independence
14 Aug 2016Program and outputs
%matplotlib inline
import pandas
import numpy
import scipy
import seaborn
import matplotlib.pyplot as plt

data = pandas.read_csv('gapminder.csv')
print('Total number of countries: {0}'.format(len(data)))
Total number of countries: 213
# Convert numeric types
data['incomeperperson'] = pandas.to_numeric(data['incomeperperson'], errors='coerce')
data['internetuserate'] = pandas.to_numeric(data['internetuserate'], errors='coerce')

sub1 = data[['incomeperperson', 'internetuserate']].dropna()

print('Remaining number of countries: {0}'.format(len(sub1)))

# Since GDP per person isn't categorical data, I'm going to group it by magnitude first
groups = [pow(10, i) for i in range(2, 6)]
labels = ['{0} - {1}'.format(groups[index], i) for index, i in enumerate(groups[1:])]
sub1['incomeperperson'] = pandas.cut(sub1['incomeperperson'], groups, right=False, labels=labels)

# Since Internet Use Rate isn't categorical, I need to group it first.
# From an earlier assignment, I know that ~20 is a noticeable cutoff for internet use rate, so lets use that.
# See: http://erikwiffin.github.io/data-visualization-course//2016/06/30/assignment-4/#internet-use-rate
groups = [0, 20, 100]
labels = ['Less than 20', 'Greater than 20']
sub1['internetuserate'] = pandas.cut(sub1['internetuserate'], groups, right=False, labels=labels)
Remaining number of countries: 183
# contingency table of observed counts
ct1 = pandas.crosstab(sub1['internetuserate'], sub1['incomeperperson'])
print('Contingency table of observed counts')
print('=' * 40)
print(ct1)

# column percentages
colsum = ct1.sum(axis=0)
colpct = ct1/colsum
print('\nColumn percentages')
print('=' * 40)
print(colpct)

# chi-square
print('\nchi-square value, p value, expected counts')
print('=' * 40)
cs1= scipy.stats.chi2_contingency(ct1)
print(cs1)

# Make them graphable again
sub2 = sub1.copy()
sub2['incomeperperson'] = sub2['incomeperperson'].astype('category')
groups = [0, 20, 100]
sub2['internetuserate'] = pandas.cut(data['internetuserate'], groups, right=False, labels=[0, 20])
sub2['internetuserate'] = pandas.to_numeric(sub2['internetuserate'], errors='coerce')
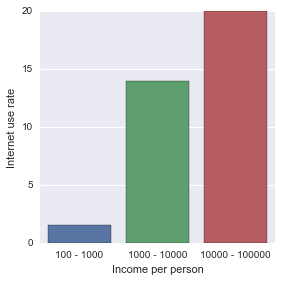
seaborn.factorplot(x="incomeperperson", y="internetuserate", data=sub2, kind="bar", ci=None)
plt.xlabel('Income per person')
plt.ylabel('Internet use rate')
Contingency table of observed counts
========================================
incomeperperson  100 - 1000  1000 - 10000  10000 - 100000
internetuserate
Less than 20             48            26               0
Greater than 20           4            60              45

Column percentages
========================================
incomeperperson  100 - 1000  1000 - 10000  10000 - 100000
internetuserate
Less than 20       0.923077      0.302326             0.0
Greater than 20    0.076923      0.697674             1.0

chi-square value, p value, expected counts
========================================
(92.356982887599486, 8.8091901262367566e-21, 2, array([[ 21.0273224 ,  34.77595628,  18.19672131],
       [ 30.9726776 ,  51.22404372,  26.80327869]]))

def recode(sub, recoding):
    sub['incomeperpersonV2'] = sub['incomeperperson'].map(recoding)

    # Header
    header = 'Comparing {0} and {1}'.format(*recoding.keys())
    print(header)
    print('=' * len(header) + '\n')

    # contingency table of observed counts
    ct = pandas.crosstab(sub['internetuserate'], sub['incomeperpersonV2'])
    print('Contingency table of observed counts')
    print('-' * len('Contingency table of observed counts'))
    print(str(ct) + '\n')

    # column percentages
    colsum = ct.sum(axis=0)
    colpct = ct/colsum
    print('Column percentages')
    print('-' * len('Column percentages'))
    print(str(colpct) + '\n')

    print('chi-square value, p value, expected counts')
    print('-' * len('chi-square value, p value, expected counts'))
    cs = scipy.stats.chi2_contingency(ct)
    print(str(cs) + '\n')

recode(sub1.copy(), {'100 - 1000': '100 - 1000', '1000 - 10000': '1000 - 10000'})
recode(sub1.copy(), {'100 - 1000': '100 - 1000', '10000 - 100000': '10000 - 100000'})
recode(sub1.copy(), {'1000 - 10000': '1000 - 10000', '10000 - 100000': '10000 - 100000'})
Comparing 100 - 1000 and 1000 - 10000
=====================================

Contingency table of observed counts
------------------------------------
incomeperpersonV2  100 - 1000  1000 - 10000
internetuserate
Less than 20               48            26
Greater than 20             4            60

Column percentages
------------------
incomeperpersonV2  100 - 1000  1000 - 10000
internetuserate
Less than 20         0.923077      0.302326
Greater than 20      0.076923      0.697674

chi-square value, p value, expected counts
------------------------------------------
(47.746562413123101, 4.8503395840347456e-12, 1, array([[ 27.88405797,  46.11594203],
       [ 24.11594203,  39.88405797]]))

Comparing 100 - 1000 and 10000 - 100000
=======================================

Contingency table of observed counts
------------------------------------
incomeperpersonV2  100 - 1000  10000 - 100000
internetuserate
Less than 20               48               0
Greater than 20             4              45

Column percentages
------------------
incomeperpersonV2  100 - 1000  10000 - 100000
internetuserate
Less than 20         0.923077             0.0
Greater than 20      0.076923             1.0

chi-square value, p value, expected counts
------------------------------------------
(78.577956612666426, 7.6902772386092302e-19, 1, array([[ 25.73195876,  22.26804124],
       [ 26.26804124,  22.73195876]]))

Comparing 1000 - 10000 and 10000 - 100000
=========================================

Contingency table of observed counts
------------------------------------
incomeperpersonV2  1000 - 10000  10000 - 100000
internetuserate
Less than 20                 26               0
Greater than 20              60              45

Column percentages
------------------
incomeperpersonV2  1000 - 10000  10000 - 100000
internetuserate
Less than 20           0.302326             0.0
Greater than 20        0.697674             1.0

chi-square value, p value, expected counts
------------------------------------------
(15.126175119023959, 0.00010055931031856319, 1, array([[ 17.06870229,   8.93129771],
       [ 68.93129771,  36.06870229]]))
Summary
With a Bonferroni adjustment of 0.05/3 = 0.017, there is a significant difference of internet use rate in all of my categories.